Materials Estimates
Five Year Outlook
Major items summary
|
Material
|
2024
|
2025
|
2026
|
2027
|
2028
|
2029
|
|
Asphalt (ton)
|
16,200
|
93,900
|
130,500
|
169,400
|
190,800
|
181,100
|
|
Aggregate (ton)
|
5,700
|
62,200
|
98,200
|
118,700
|
129,800
|
130,400
|
|
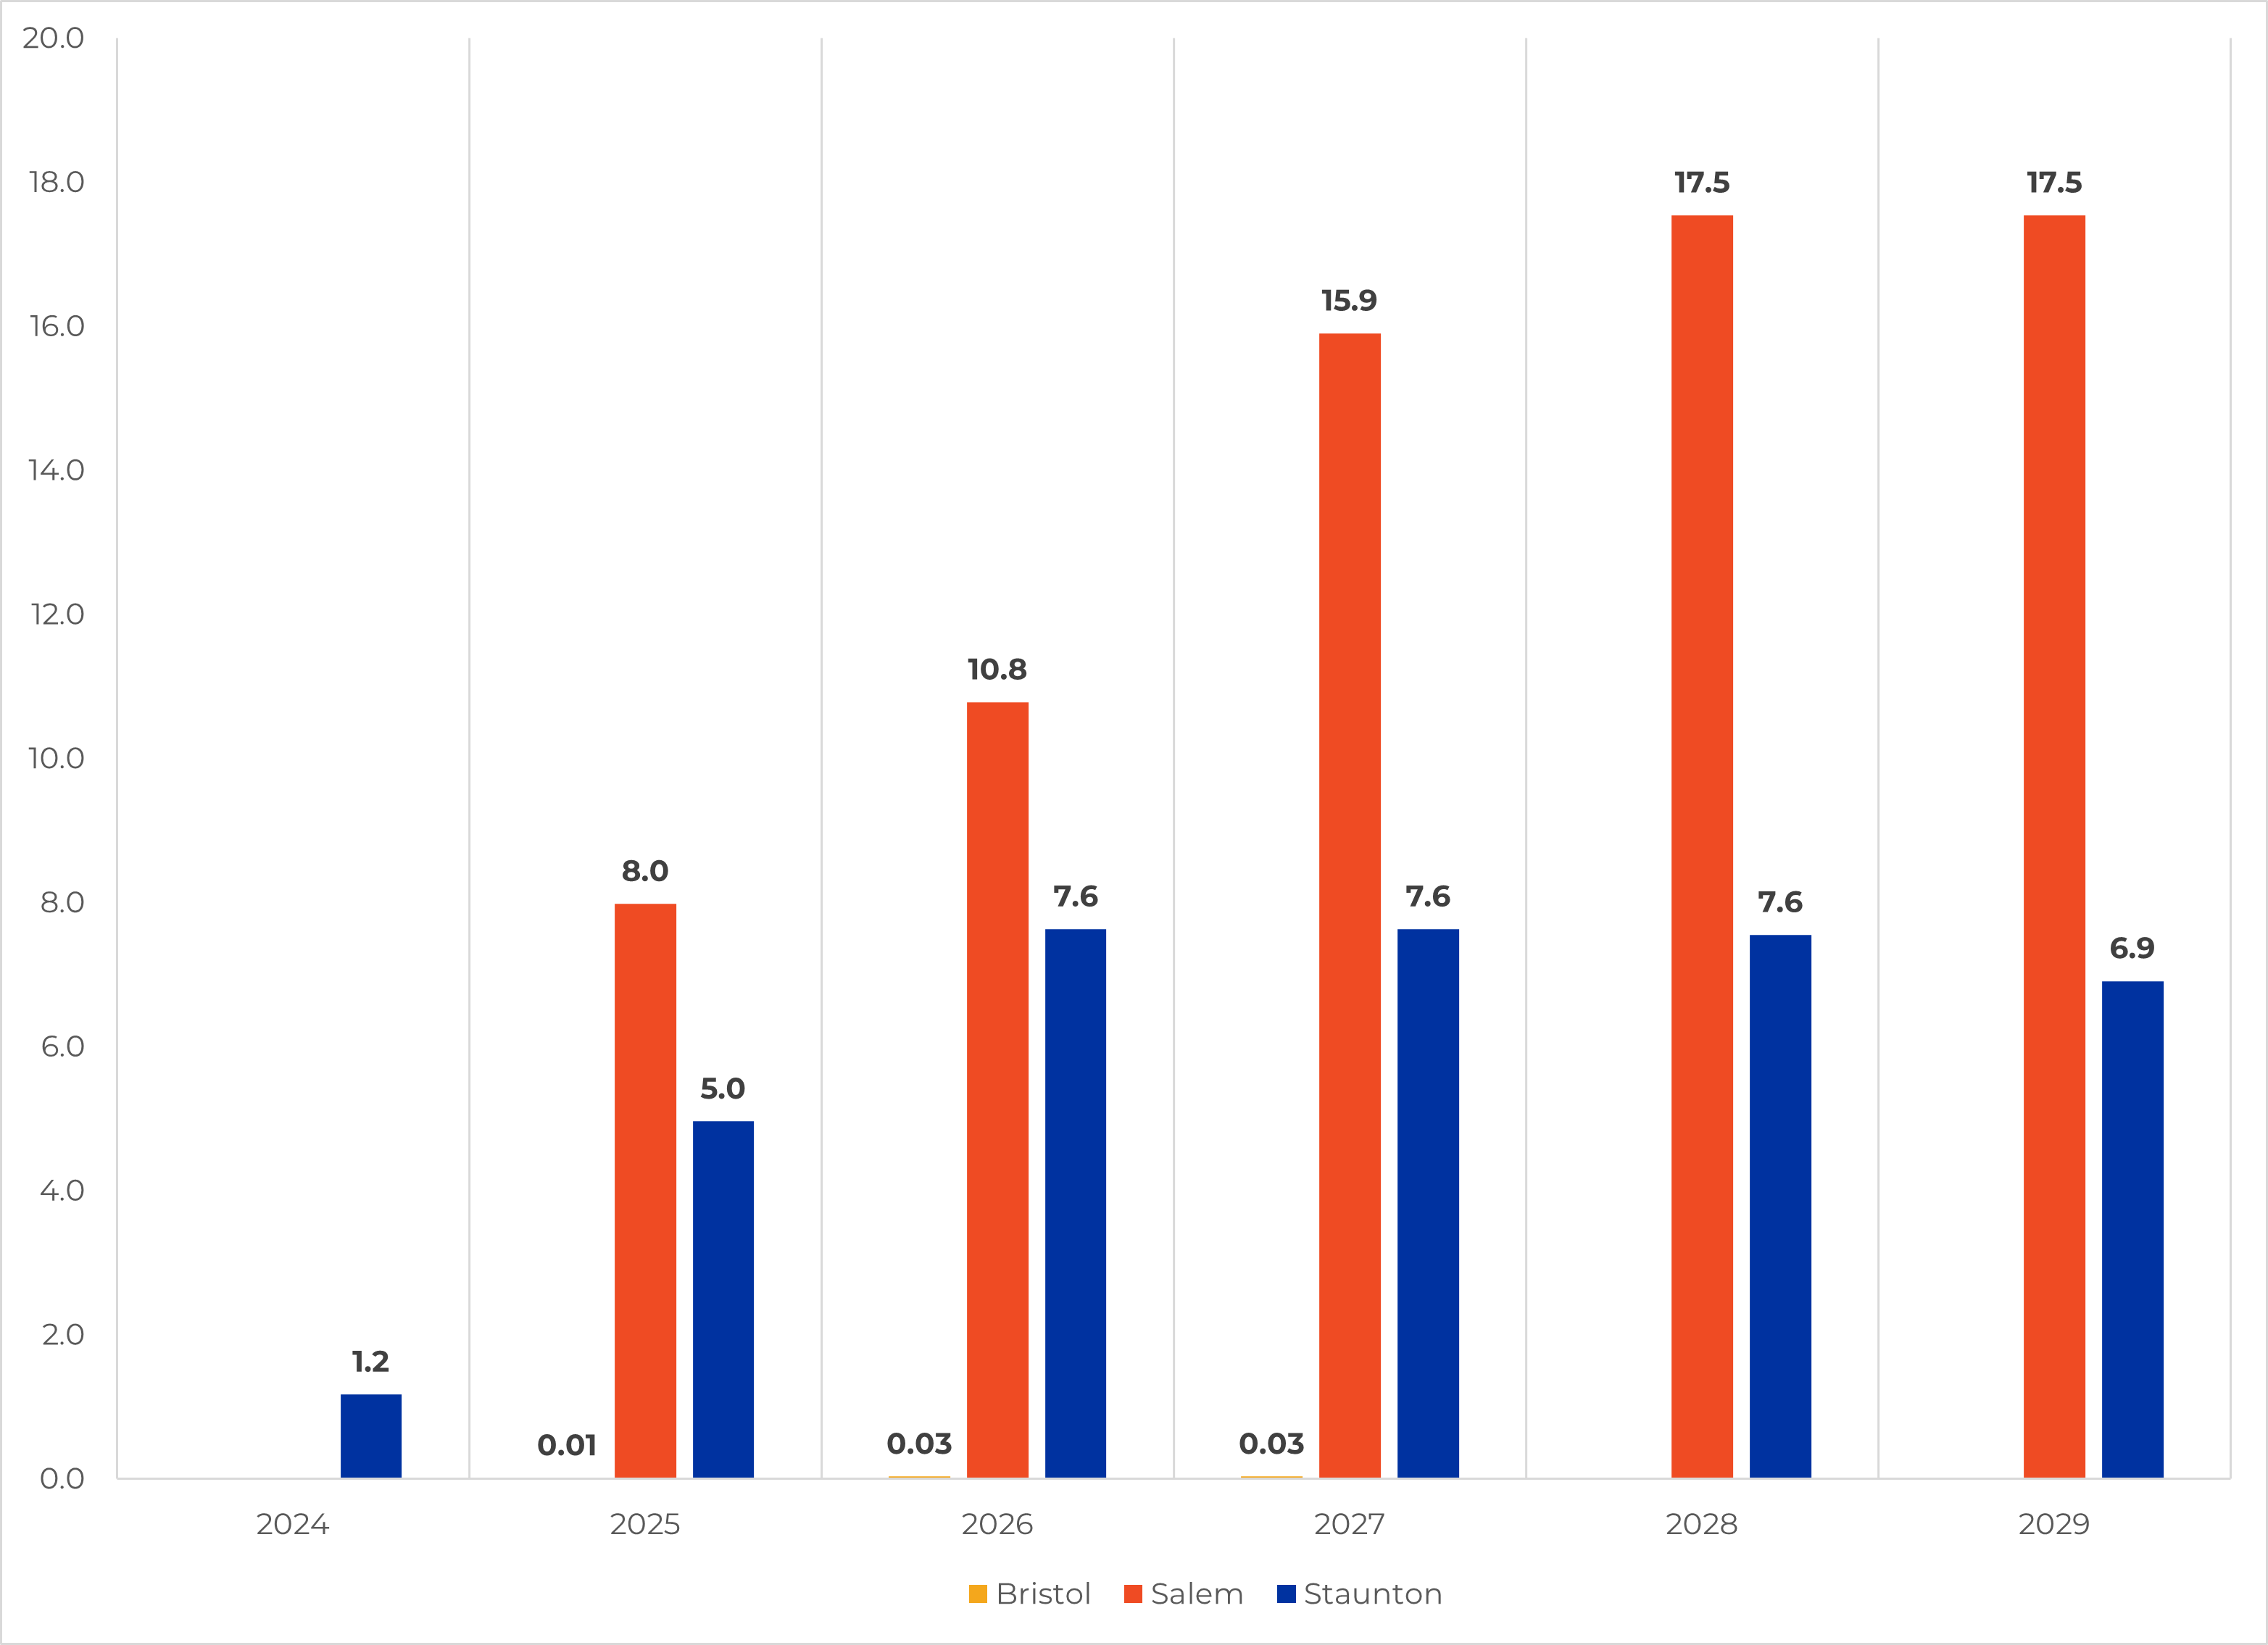
Pipe (linear feet)
|
1,170
|
12,950
|
18,440
|
23,560
|
25,090
|
24,450
|
|
Guardrail (linear feet)
|
5,700
|
22,900
|
29,100
|
35,600
|
41,300
|
39,500
|
| Material |
2024 - 2029 |
| Structures (each) |
40 |
« Back to intro screen
Major Quantities Corridor-Wide
Calendar Years 2024 - 2029
|
Item
|
Bristol Details
|
Salem Details
|
Staunton Details
|
Grand Total
|
|
Category
|
Item Description
|
Unit
|
Quantity
|
|
Drainage
|
Box Culvert (Any Size)
|
linear feet
|
0
|
1,360
|
720
|
2,080
|
|
Conc. Pipes Under 36"
|
linear feet
|
70
|
58,090
|
30,100
|
88,260
|
|
Conc. Pipes Over 36"
|
linear feet
|
0
|
7,360
|
3,430
|
10,790
|
|
Jacked & Bored Pipes Under 36"
|
linear feet
|
0
|
1,550
|
1,330
|
2,880
|
|
Jacked & Bored Pipes Over 36"
|
linear feet
|
0
|
2,140
|
270
|
2,410
|
|
Manhole & Inlets
|
linear feet
|
7
|
610
|
400
|
1,017
|
|
Endsection & Endwalls
|
linear feet
|
30
|
300
|
230
|
560
|
|
Curb & Gutter
|
ton
|
210
|
8,270
|
6,580
|
15,060
|
|
Pavement
|
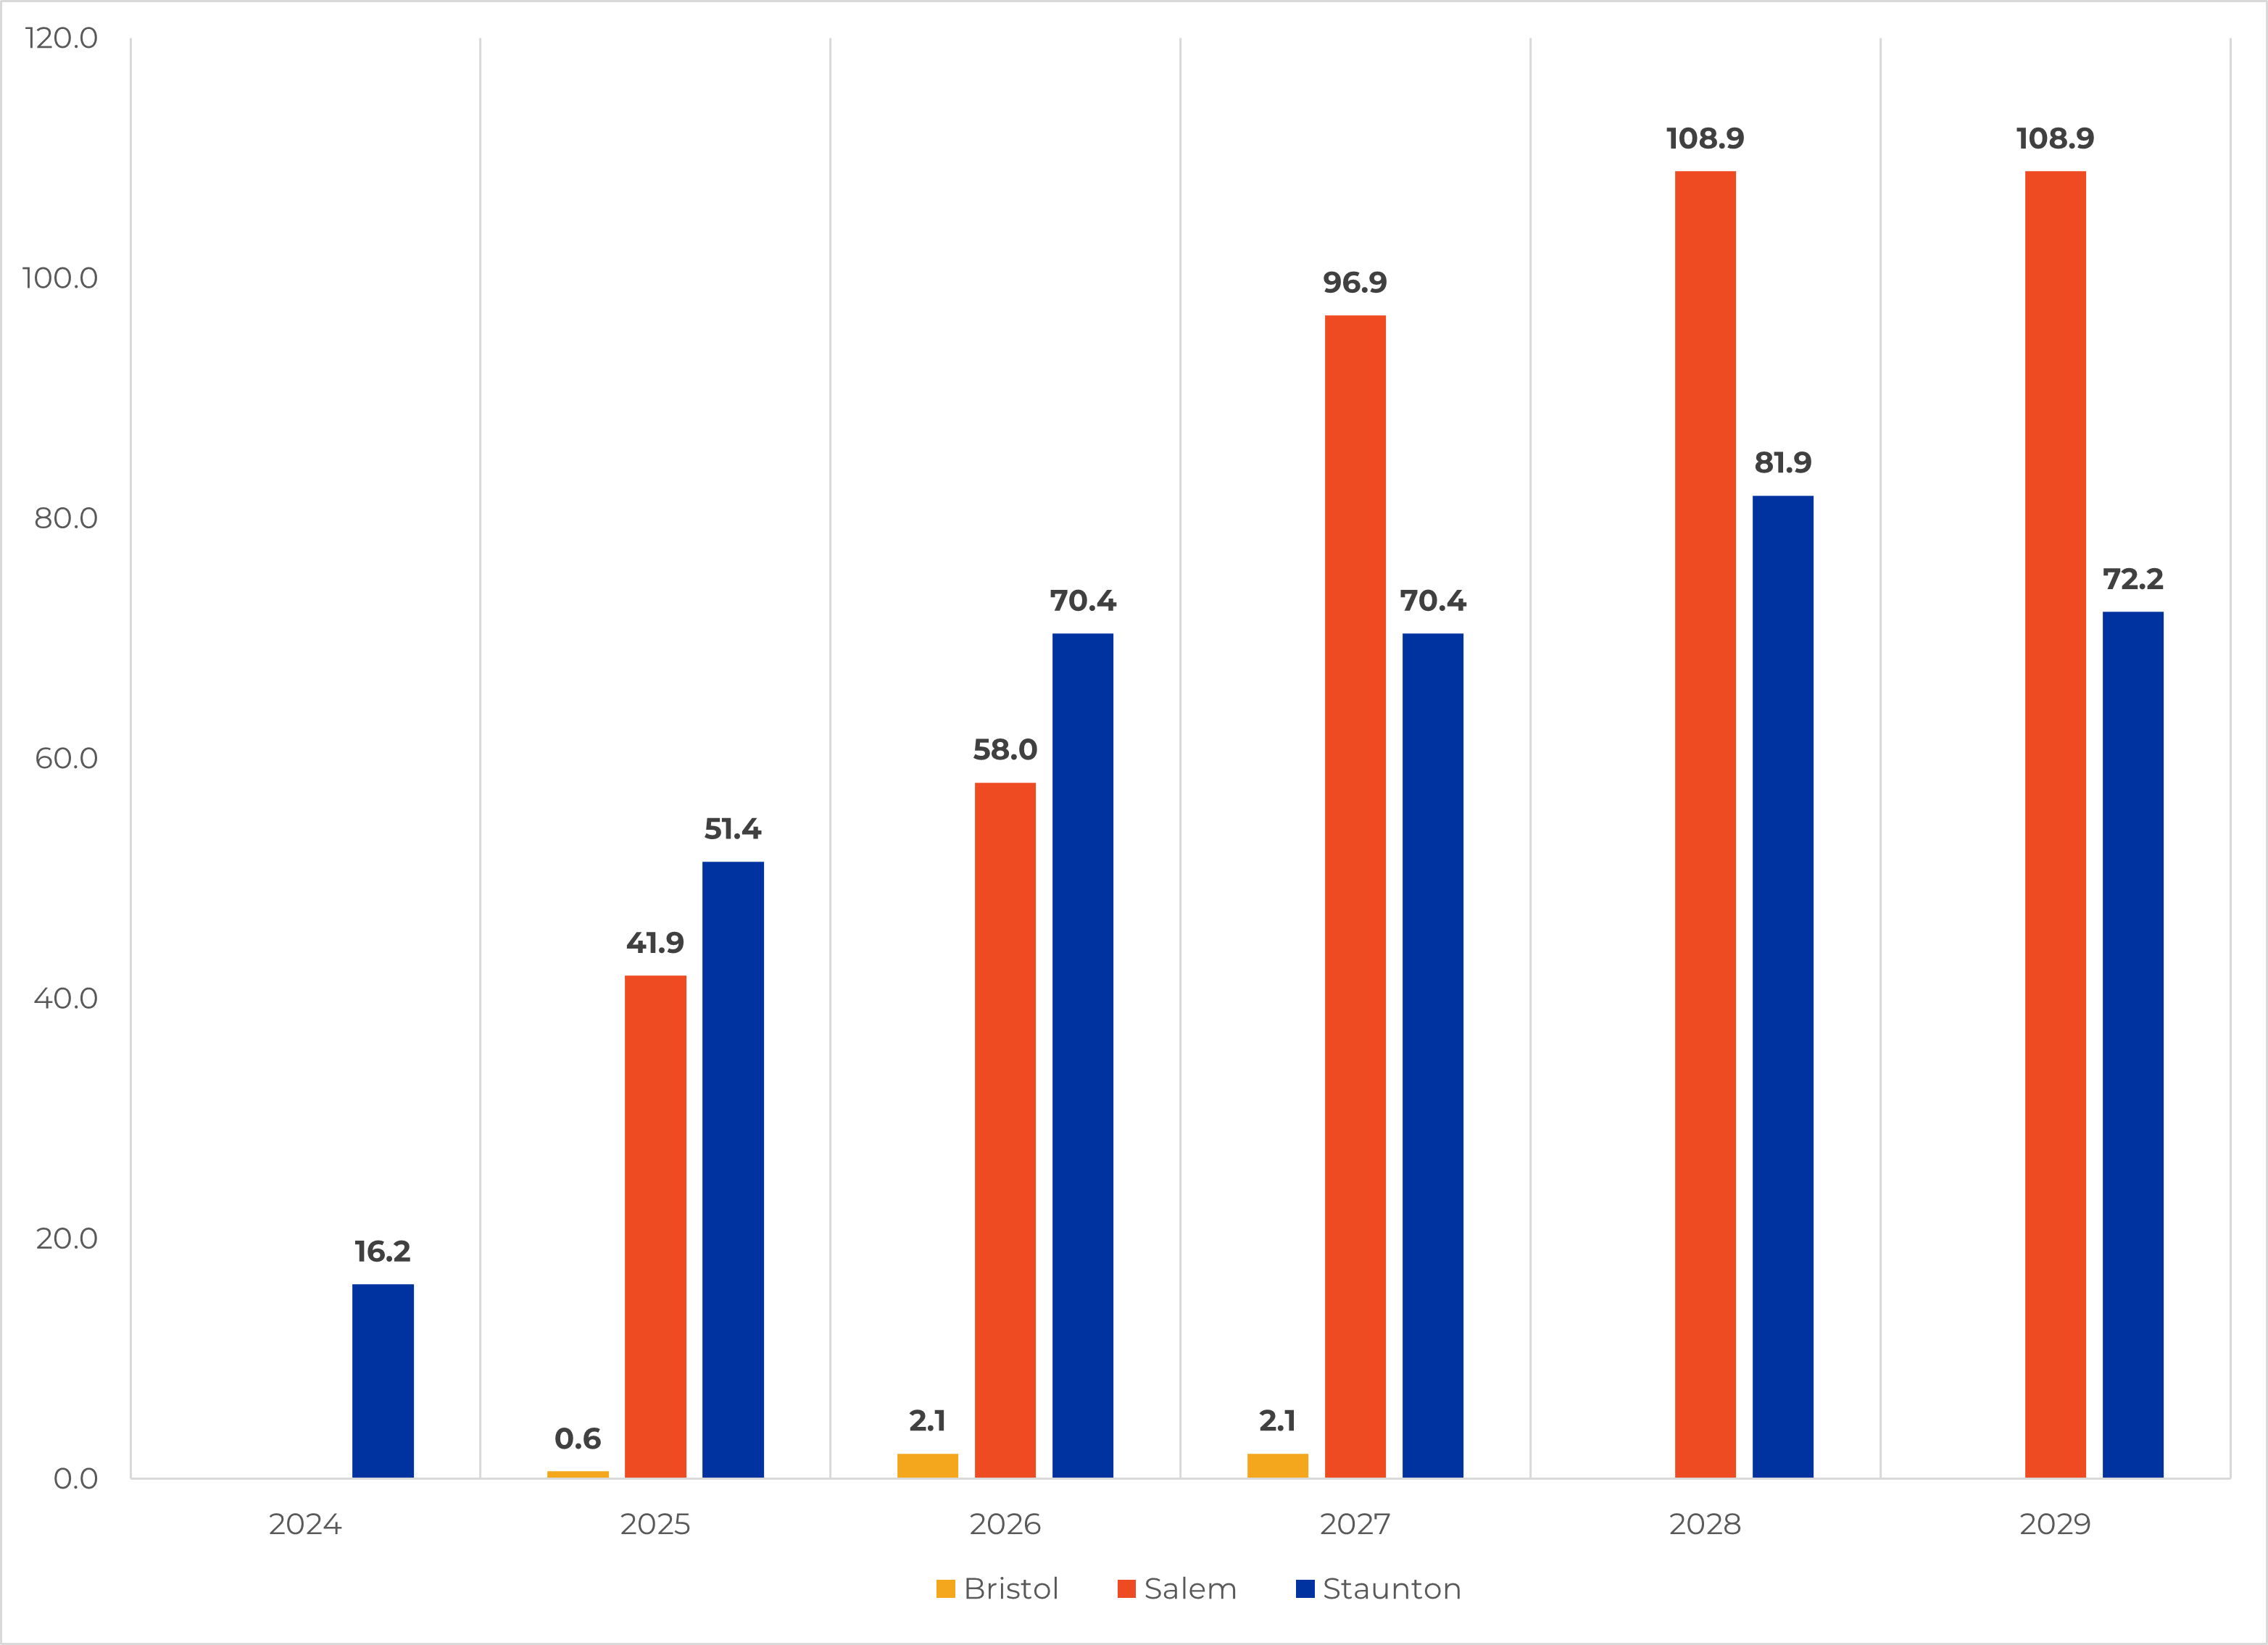
Asphalt (Any Type)
|
ton
|
4,800
|
414,600
|
362,500
|
781,900
|
|
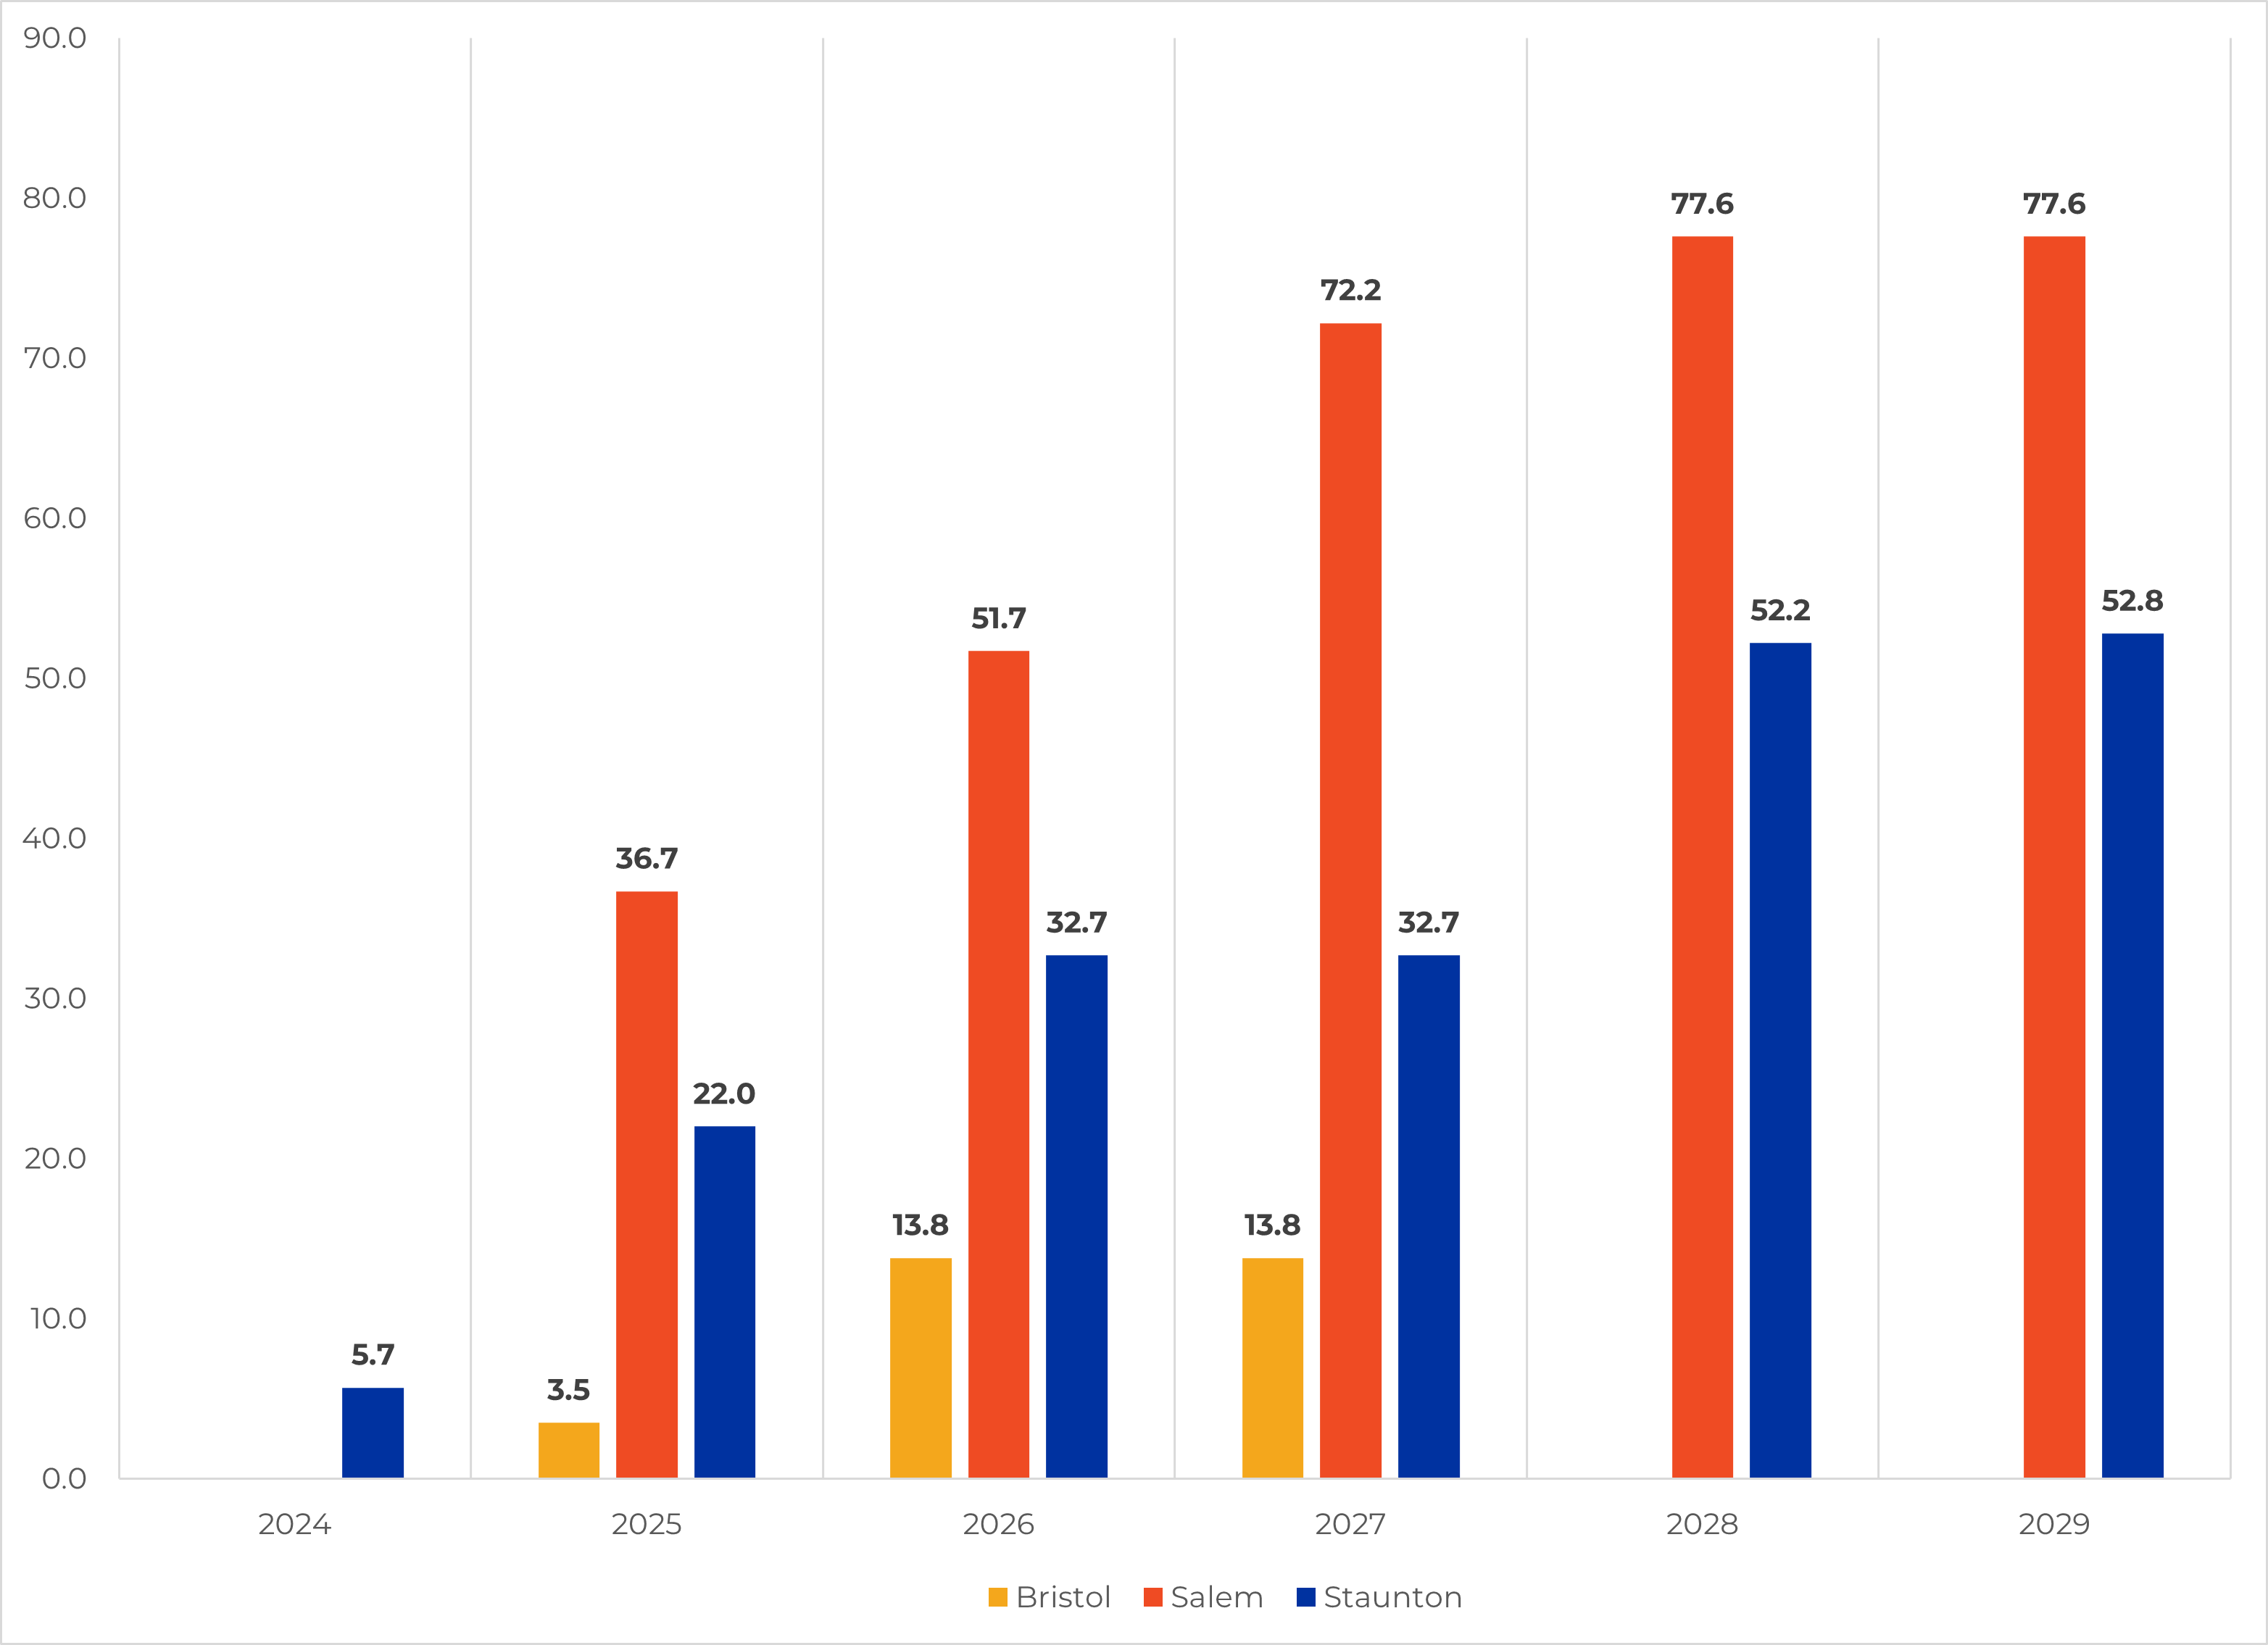
Aggregate
|
linear feet
|
31,100
|
315,800
|
198,100
|
545,000
|
|
Traffic and Safety
|
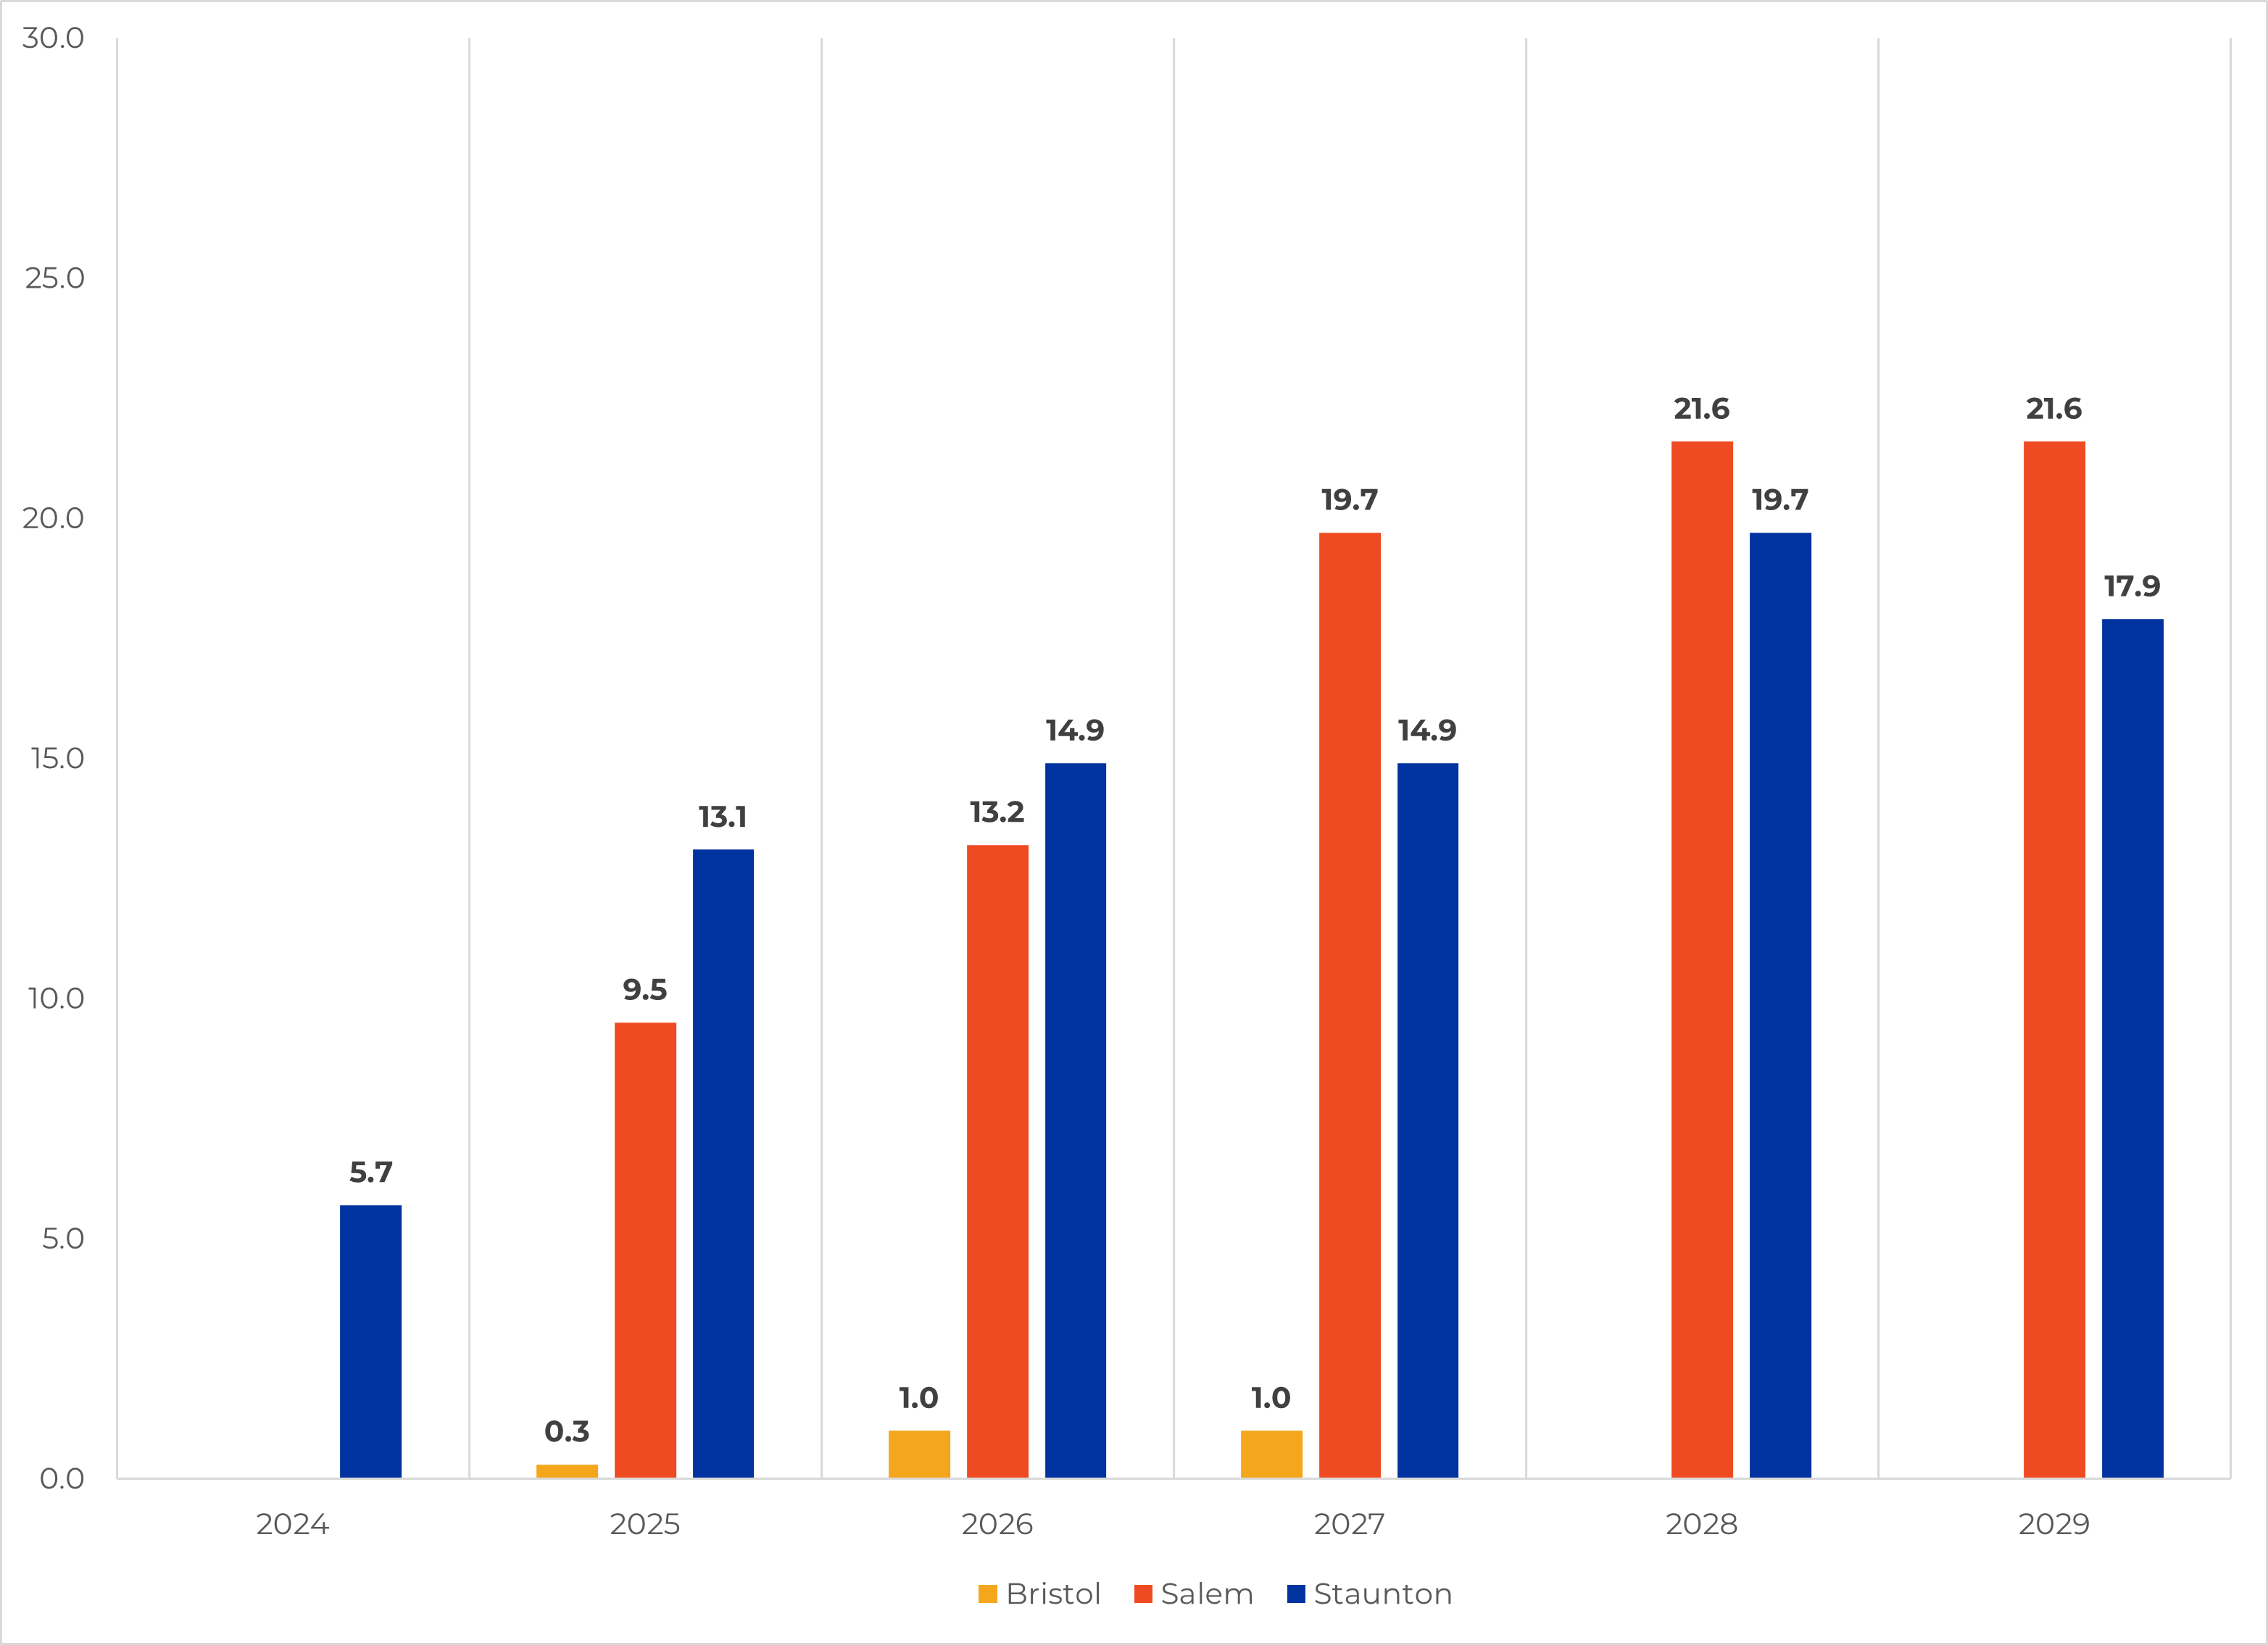
Guardrail (Any Type)
|
linear feet
|
2,300
|
85,600
|
86,200
|
174,100
|
|
End Treatment (Any Type)
|
linear feet
|
30
|
160
|
260
|
450
|
|
Concrete Barrier - Temporary
|
linear feet
|
4,600
|
372,800
|
300,200
|
677,600
|
|
Concrete Barrier - Permanent
|
linear feet
|
0
|
37,600
|
40,000
|
77,600
|
|
Structures
|
*Bridge ( Deck Area)
|
square feet
|
7,900
|
95,800
|
184,900
|
288,600
|
|
Noise Barrier Wall
|
square feet
|
0
|
536,100
|
355,100
|
891,200
|
|
Retaining Wall
|
square feet
|
10,800
|
17,700
|
4,500
|
33,000
|
|
|
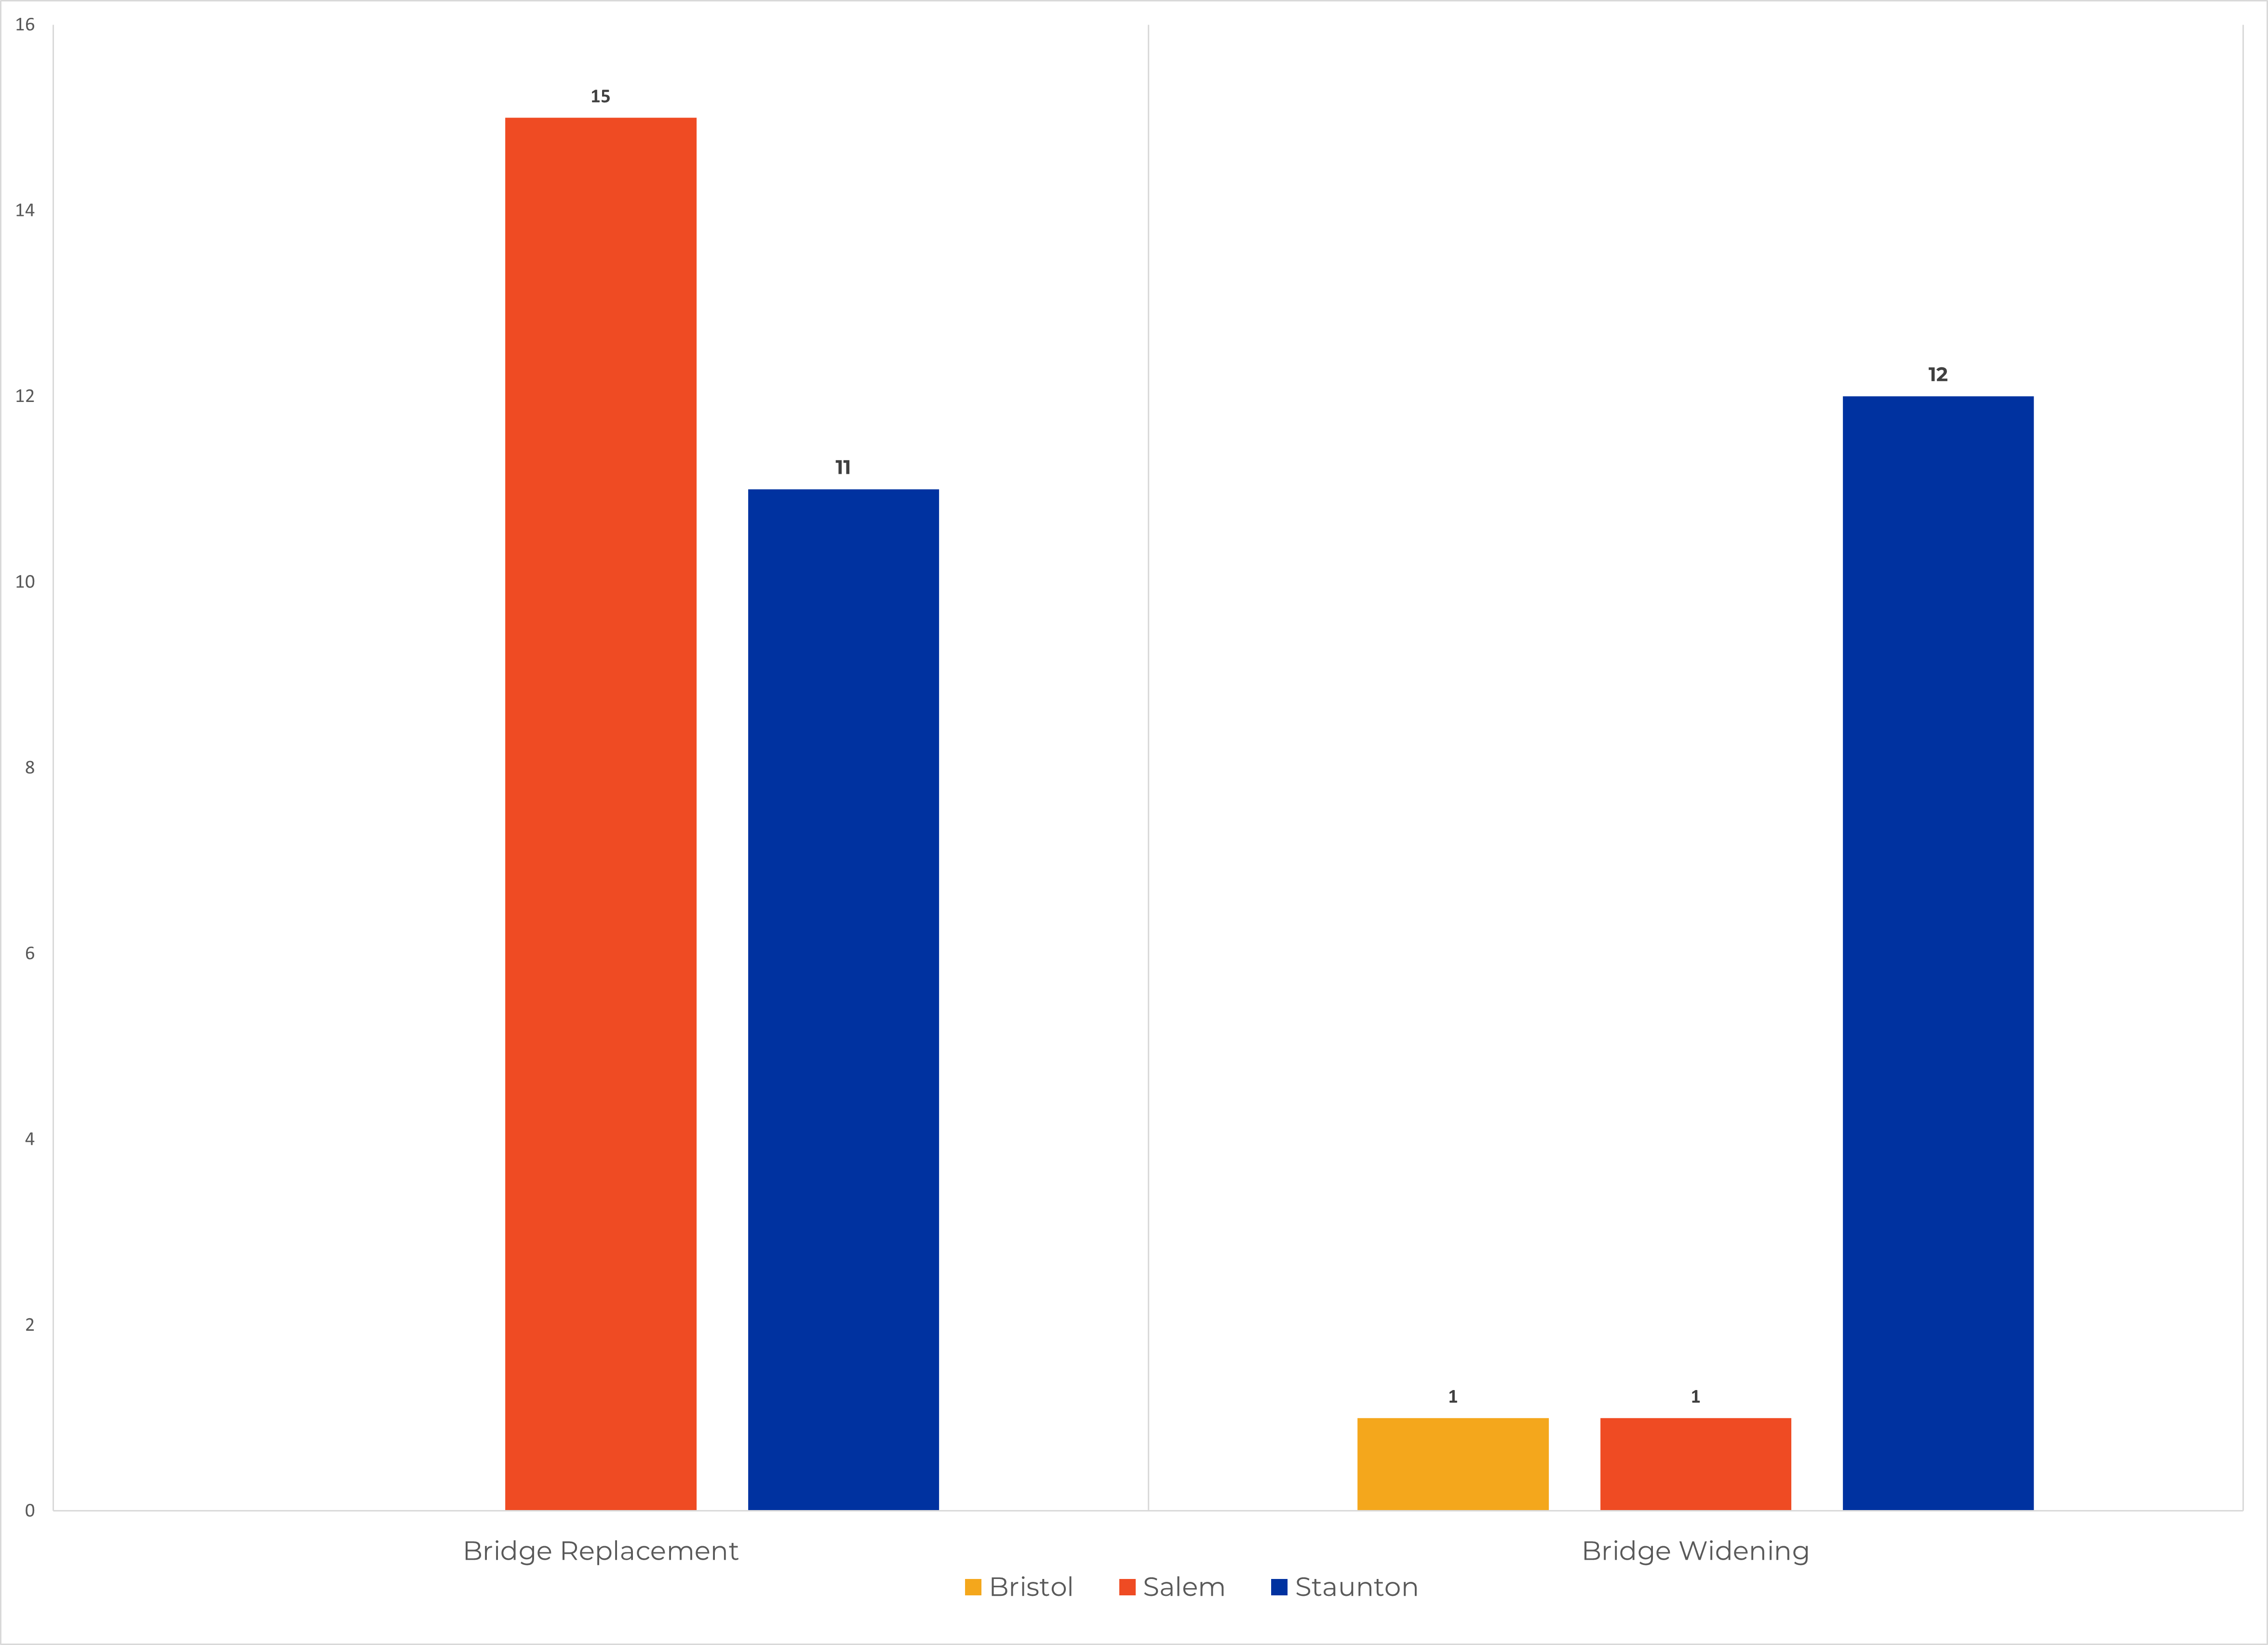
*Number of bridges for
|
|
Bridge Replacement
|
Bridge Widening
|
|
Bristol District
|
0
|
1
|
|
Salem District
|
15
|
1
|
|
Staunton District
|
11
|
12
|
« Back to intro screen
Bristol
- Bristol Area Overview
- Bristol Major Quantities
Bristol Major Quantities
|
Item
|
2024
|
2025
|
2026
|
2027
|
|
Category
|
Item Description
|
Unit
|
Quantity
|
|
Drainage
|
Box Culvert (any size)
|
linear feet
|
0
|
0
|
0
|
0
|
|
Concrete Pipes Under 36"
|
linear feet
|
0
|
10
|
30
|
30
|
|
Concrete Pipes Over 36"
|
linear feet
|
0
|
0
|
0
|
0
|
|
Jacked & Bored Pipes Under 36"
|
linear feet
|
0
|
0
|
0
|
0
|
|
Jacked & Bored Pipes Over 36"
|
linear feet
|
0
|
0
|
0
|
0
|
|
Manhole & Inlets
|
linear feet
|
0
|
1
|
3
|
3
|
|
Endsection & Endwalls
|
linear feet
|
0
|
10
|
10
|
10
|
|
Curb & Gutter
|
linear feet
|
0
|
30
|
90
|
90
|
|
Pavement
|
Asphalt (any type)
|
ton
|
0
|
600
|
2,100
|
2,100
|
|
Aggregate
|
ton
|
0
|
3,500
|
13,800
|
13,800
|
|
Traffic and Safety
|
Guardrail (any type)
|
linear feet
|
0
|
300
|
1,000
|
1,000
|
|
End Treatment (any type)
|
linear feet
|
0
|
10
|
10
|
10
|
|
Concrete Barrier - Temporary
|
linear feet
|
0
|
4,600
|
0
|
0
|
|
Concrete Barrier - Permanent
|
linear feet
|
0
|
0
|
0
|
0
|
|
Structures
|
*Bridge (deck area)
|
square feet
|
0
|
900
|
3,500
|
3,500
|
|
Noise Barrier Wall
|
square feet
|
0
|
0
|
0
|
0
|
|
Retaining Wall
|
square feet
|
0
|
1,200
|
4,800
|
4,800
|
|
|
*Number of bridges for
|
|
Bridge Replacement
|
Bridge Widening
|
|
Bristol District
|
0
|
1
|
« Back to intro screen
Staunton
- Staunton Area Overview
- Staunton Major Quantities
Staunton Major Quantities
|
Item
|
2024
|
2025
|
2026
|
2027
|
2028
|
2029
|
|
Category
|
Item Description
|
Unit
|
Quantity
|
|
Drainage
|
Box Culvert (any size)
|
linear feet
|
60
|
120
|
120
|
120
|
170
|
130
|
|
Concrete Pipes Under 36"
|
linear feet
|
710
|
3,960
|
6,520
|
6,520
|
6,350
|
6,040
|
|
Concrete Pipes Over 36"
|
linear feet
|
340
|
680
|
690
|
690
|
650
|
380
|
|
Jacked & Bored Pipes Under 36"
|
linear feet
|
40
|
170
|
270
|
270
|
300
|
280
|
|
Jacked & Bored Pipes Over 36"
|
linear feet
|
20
|
30
|
30
|
30
|
80
|
80
|
|
Manhole & Inlets
|
linear feet
|
10
|
50
|
80
|
80
|
90
|
90
|
|
Endsection & Endwalls
|
linear feet
|
20
|
40
|
50
|
50
|
40
|
30
|
|
Curb & Gutter
|
linear feet
|
150
|
820
|
1,340
|
1,340
|
1,490
|
1,440
|
|
Pavement
|
Asphalt (any type)
|
ton
|
16,200
|
51,400
|
70,400
|
70,400
|
81,900
|
72,200
|
|
Aggregate
|
ton
|
5,700
|
22,000
|
32,700
|
32,700
|
52,200
|
52,800
|
|
Traffic and Safety
|
Guardrail (any type)
|
linear feet
|
5,700
|
13,100
|
14,900
|
14,900
|
19,700
|
17,900
|
|
End Treatment (any type)
|
linear feet
|
20
|
50
|
50
|
50
|
50
|
40
|
|
Concrete Barrier - Temporary
|
linear feet
|
68,000
|
151,100
|
0
|
0
|
81,100
|
0
|
|
Concrete Barrier - Permanent
|
linear feet
|
400
|
4,400
|
8,000
|
8,000
|
9,500
|
9,700
|
|
Structures
|
*Bridge (deck area)
|
square feet
|
7,700
|
23,800
|
32,300
|
32,300
|
41,200
|
47,600
|
|
Noise Barrier Wall
|
square feet
|
0
|
39,500
|
78,900
|
78,900
|
78,900
|
78,900
|
|
Retaining Wall
|
square feet
|
0
|
500
|
1,000
|
1,000
|
1,000
|
1,000
|
|
|
*Number of bridges for
|
|
Bridge Replacement
|
Bridge Widening
|
|
Staunton District
|
11
|
12
|
« Back to intro screen
Salem
- Salem Area Overview
- Salem Major Quantities
Salem Major Quantities
|
Item
|
2024
|
2025
|
2026
|
2027
|
2028
|
2029
|
|
Category
|
Item Description
|
Unit
|
Quantity
|
|
Drainage
|
Box Culvert (any size)
|
linear feet
|
0
|
180
|
240
|
300
|
320
|
320
|
|
Concrete Pipes Under 36"
|
linear feet
|
0
|
6,620
|
8,920
|
13,250
|
14,650
|
14,650
|
|
Concrete Pipes Over 36"
|
linear feet
|
0
|
840
|
1,170
|
1,690
|
1,830
|
1,830
|
|
Jacked & Bored Pipes Under 36"
|
linear feet
|
0
|
180
|
240
|
350
|
390
|
390
|
|
Jacked & Bored Pipes Over 36"
|
linear feet
|
0
|
160
|
210
|
310
|
350
|
350
|
|
Manhole & Inlets
|
linear feet
|
0
|
70
|
100
|
140
|
150
|
150
|
|
Endsection & Endwalls
|
linear feet
|
0
|
40
|
50
|
70
|
70
|
70
|
|
Curb & Gutter
|
linear feet
|
0
|
960
|
1,510
|
1,920
|
1,940
|
1,940
|
|
Pavement
|
Asphalt (any type)
|
ton
|
0
|
41,900
|
58,000
|
96,900
|
108,900
|
108,900
|
|
Aggregate
|
ton
|
0
|
36,700
|
51,700
|
72,200
|
77,600
|
77,600
|
|
Traffic and Safety
|
Guardrail (any type)
|
linear feet
|
0
|
9,500
|
13,200
|
19,700
|
21,600
|
21,600
|
|
End Treatment (any type)
|
linear feet
|
0
|
20
|
20
|
40
|
40
|
40
|
|
Concrete Barrier - Temporary
|
linear feet
|
0
|
230,200
|
0
|
142,600
|
0
|
0
|
|
Concrete Barrier - Permanent
|
linear feet
|
0
|
3,700
|
5,900
|
9,000
|
9,500
|
9,500
|
|
Structures
|
*Bridge (deck area)
|
square feet
|
0
|
14,500
|
19,300
|
20,400
|
20,800
|
20,800
|
|
Noise Barrier Wall
|
square feet
|
0
|
73,900
|
98,500
|
117,100
|
123,300
|
123,300
|
|
Retaining Wall
|
square feet
|
0
|
1,400
|
1,800
|
4,300
|
5,100
|
5,100
|
|
|
*Number of bridges for
|
|
Bridge Replacement
|
Bridge Widening
|
|
Salem District
|
15
|
1
|
July 2024 Update – Data for planning purposes only, data subject to change.
Last updated: July 18, 2024